
In Metro Manila, the goal of billboard ad placement is to be noticed by the proper people in the middle of their everyday lives, not just to be visible. It takes more than just gut feeling to decide where to put a billboard because millions of people travel through major thoroughfares, commercial areas, and transportation hubs every day. It necessitates knowledge about area demographics, dwell duration, and foot traffic.
Advertisers need to think not only about who is going through a particular space but also for how long they are in fact in front of an advert before making a lock-up decision. Foot traffic measures the number of people going through a particular space, and dwell time records the duration that people spend in a particular space; these are some key measures that will be able to answer this question. This is especially important in a location where people have to commute for a long period through heavy traffic.
With Calton Datx, you have verifiable dwell time data to help strengthen your ROI on DOOH campaigns. Do better in outdoor advertising through precision-driven insights.
The Most Effective Billboard Locations Leverage Foot Traffic Data
The number of individuals passing by a location either by foot or by car or waiting nearby is termed as foot traffic. Major roads, transportation terminals, and business centers are examples of areas with high foot traffic. Even if there are fewer impressions that can be gained from a low foot traffic area, they can still prove to be well-received if they are aimed at a certain or highly focused audience.

The usage of geo-fenced analysis in this particular case is very significant. The people who are actually viewed by a billboard can be identified by checking a particular area around it. Take, for example, EDSA Street in the Philippines. This is one of the busiest roads in the country. Seeing bus stops, MRTs, business districts, and just simple road congestion in a particular area makes an area like EDSA stand out because of its high foot traffic and high dwell time.

Age and Lifestyle
The number of persons passing through a place, whether on foot, in cars, or waiting nearby, is referred to as foot traffic. Major thoroughfares, transit hubs, and business districts are examples of Metro Manila’s high foot traffic locations. Even while there may be fewer impressions in low-foot traffic regions, they can still be beneficial if they reach a particular or highly focused demographic.

Commute Patterns
Geo-fenced analysis is crucial in this situation. Advertisers can determine who is truly exposed to a billboard by looking at a specific radius surrounding it. Consider EDSA, one of the Philippines’ busiest thoroughfares. Bus stops, MRT stations, commercial centers, and everyday traffic congestion all contribute to the area’s obvious high foot activity.

Foot traffic Analysis
The movement of persons inside the viewing area of a billboard is mapped by foot traffic analysis. It helps advertisers assess how frequently people see an advertisement and how long it remains in view during slow traffic or stop-and-go situations by displaying traffic flow, repeat exposure, and movement speed.
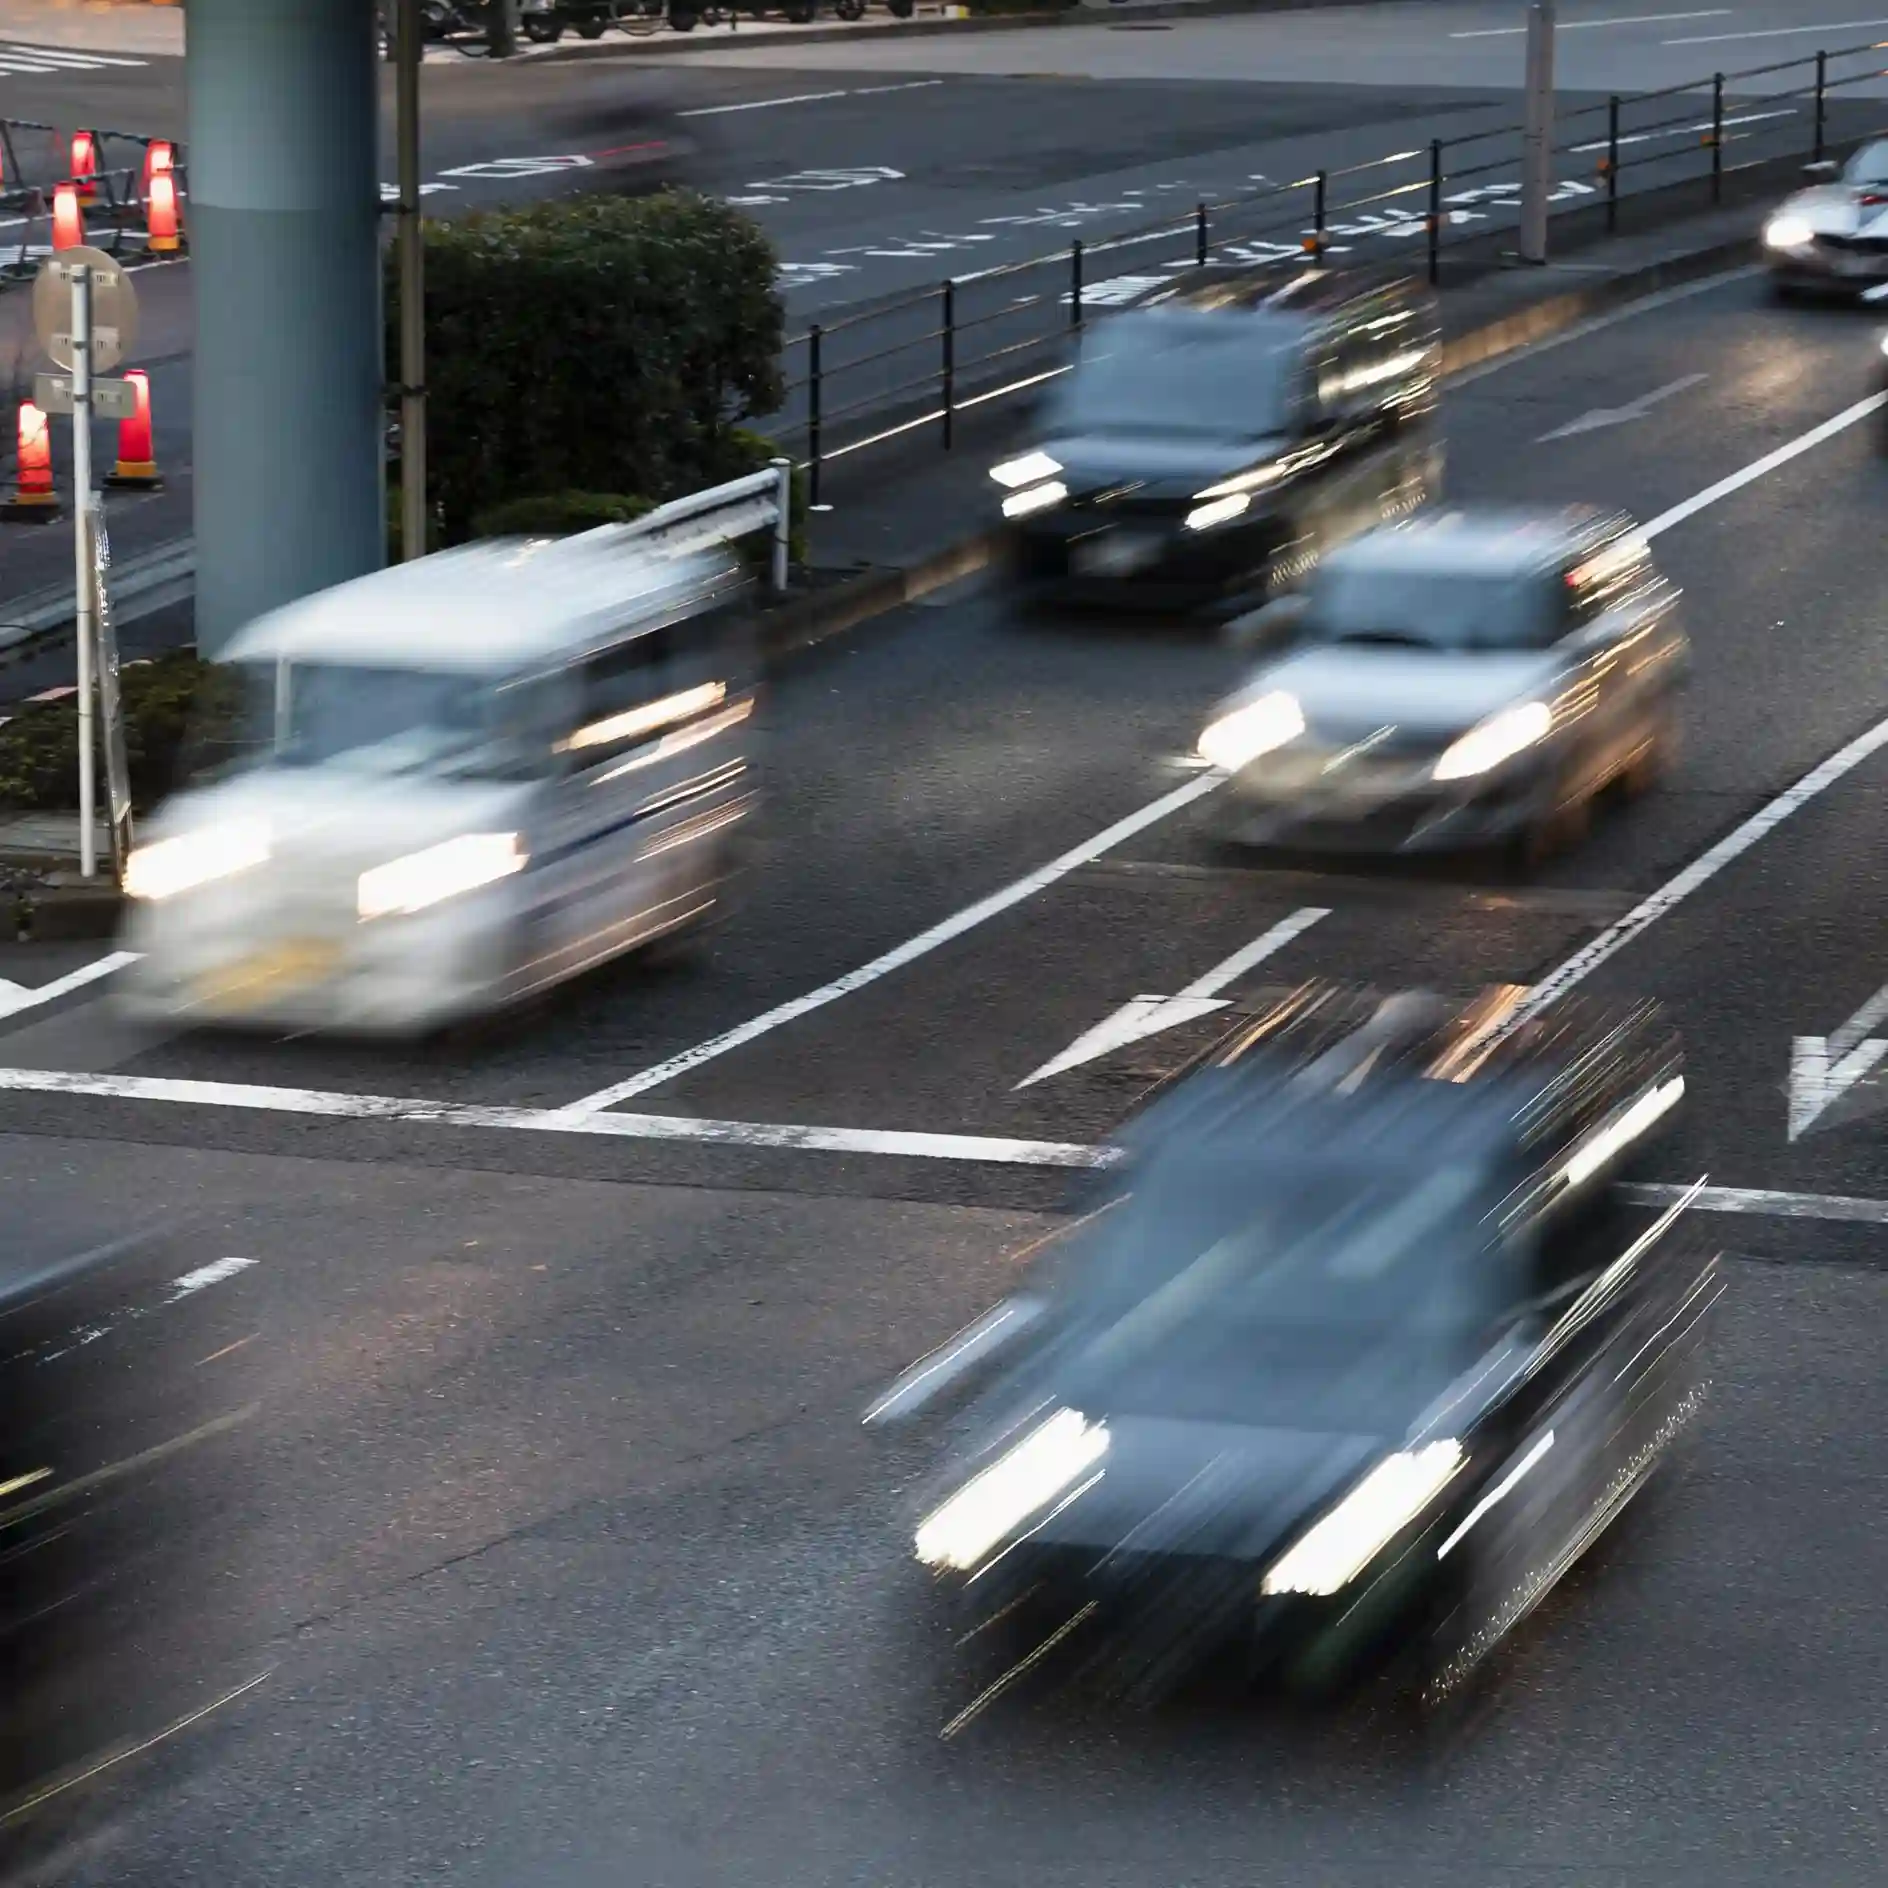
Daily Vehicle Count
The number of cars that pass a billboard every day is measured by this conventional OOH metric. This figure can be high in Metro Manila, but it doesn’t indicate audience engagement or quality without context.
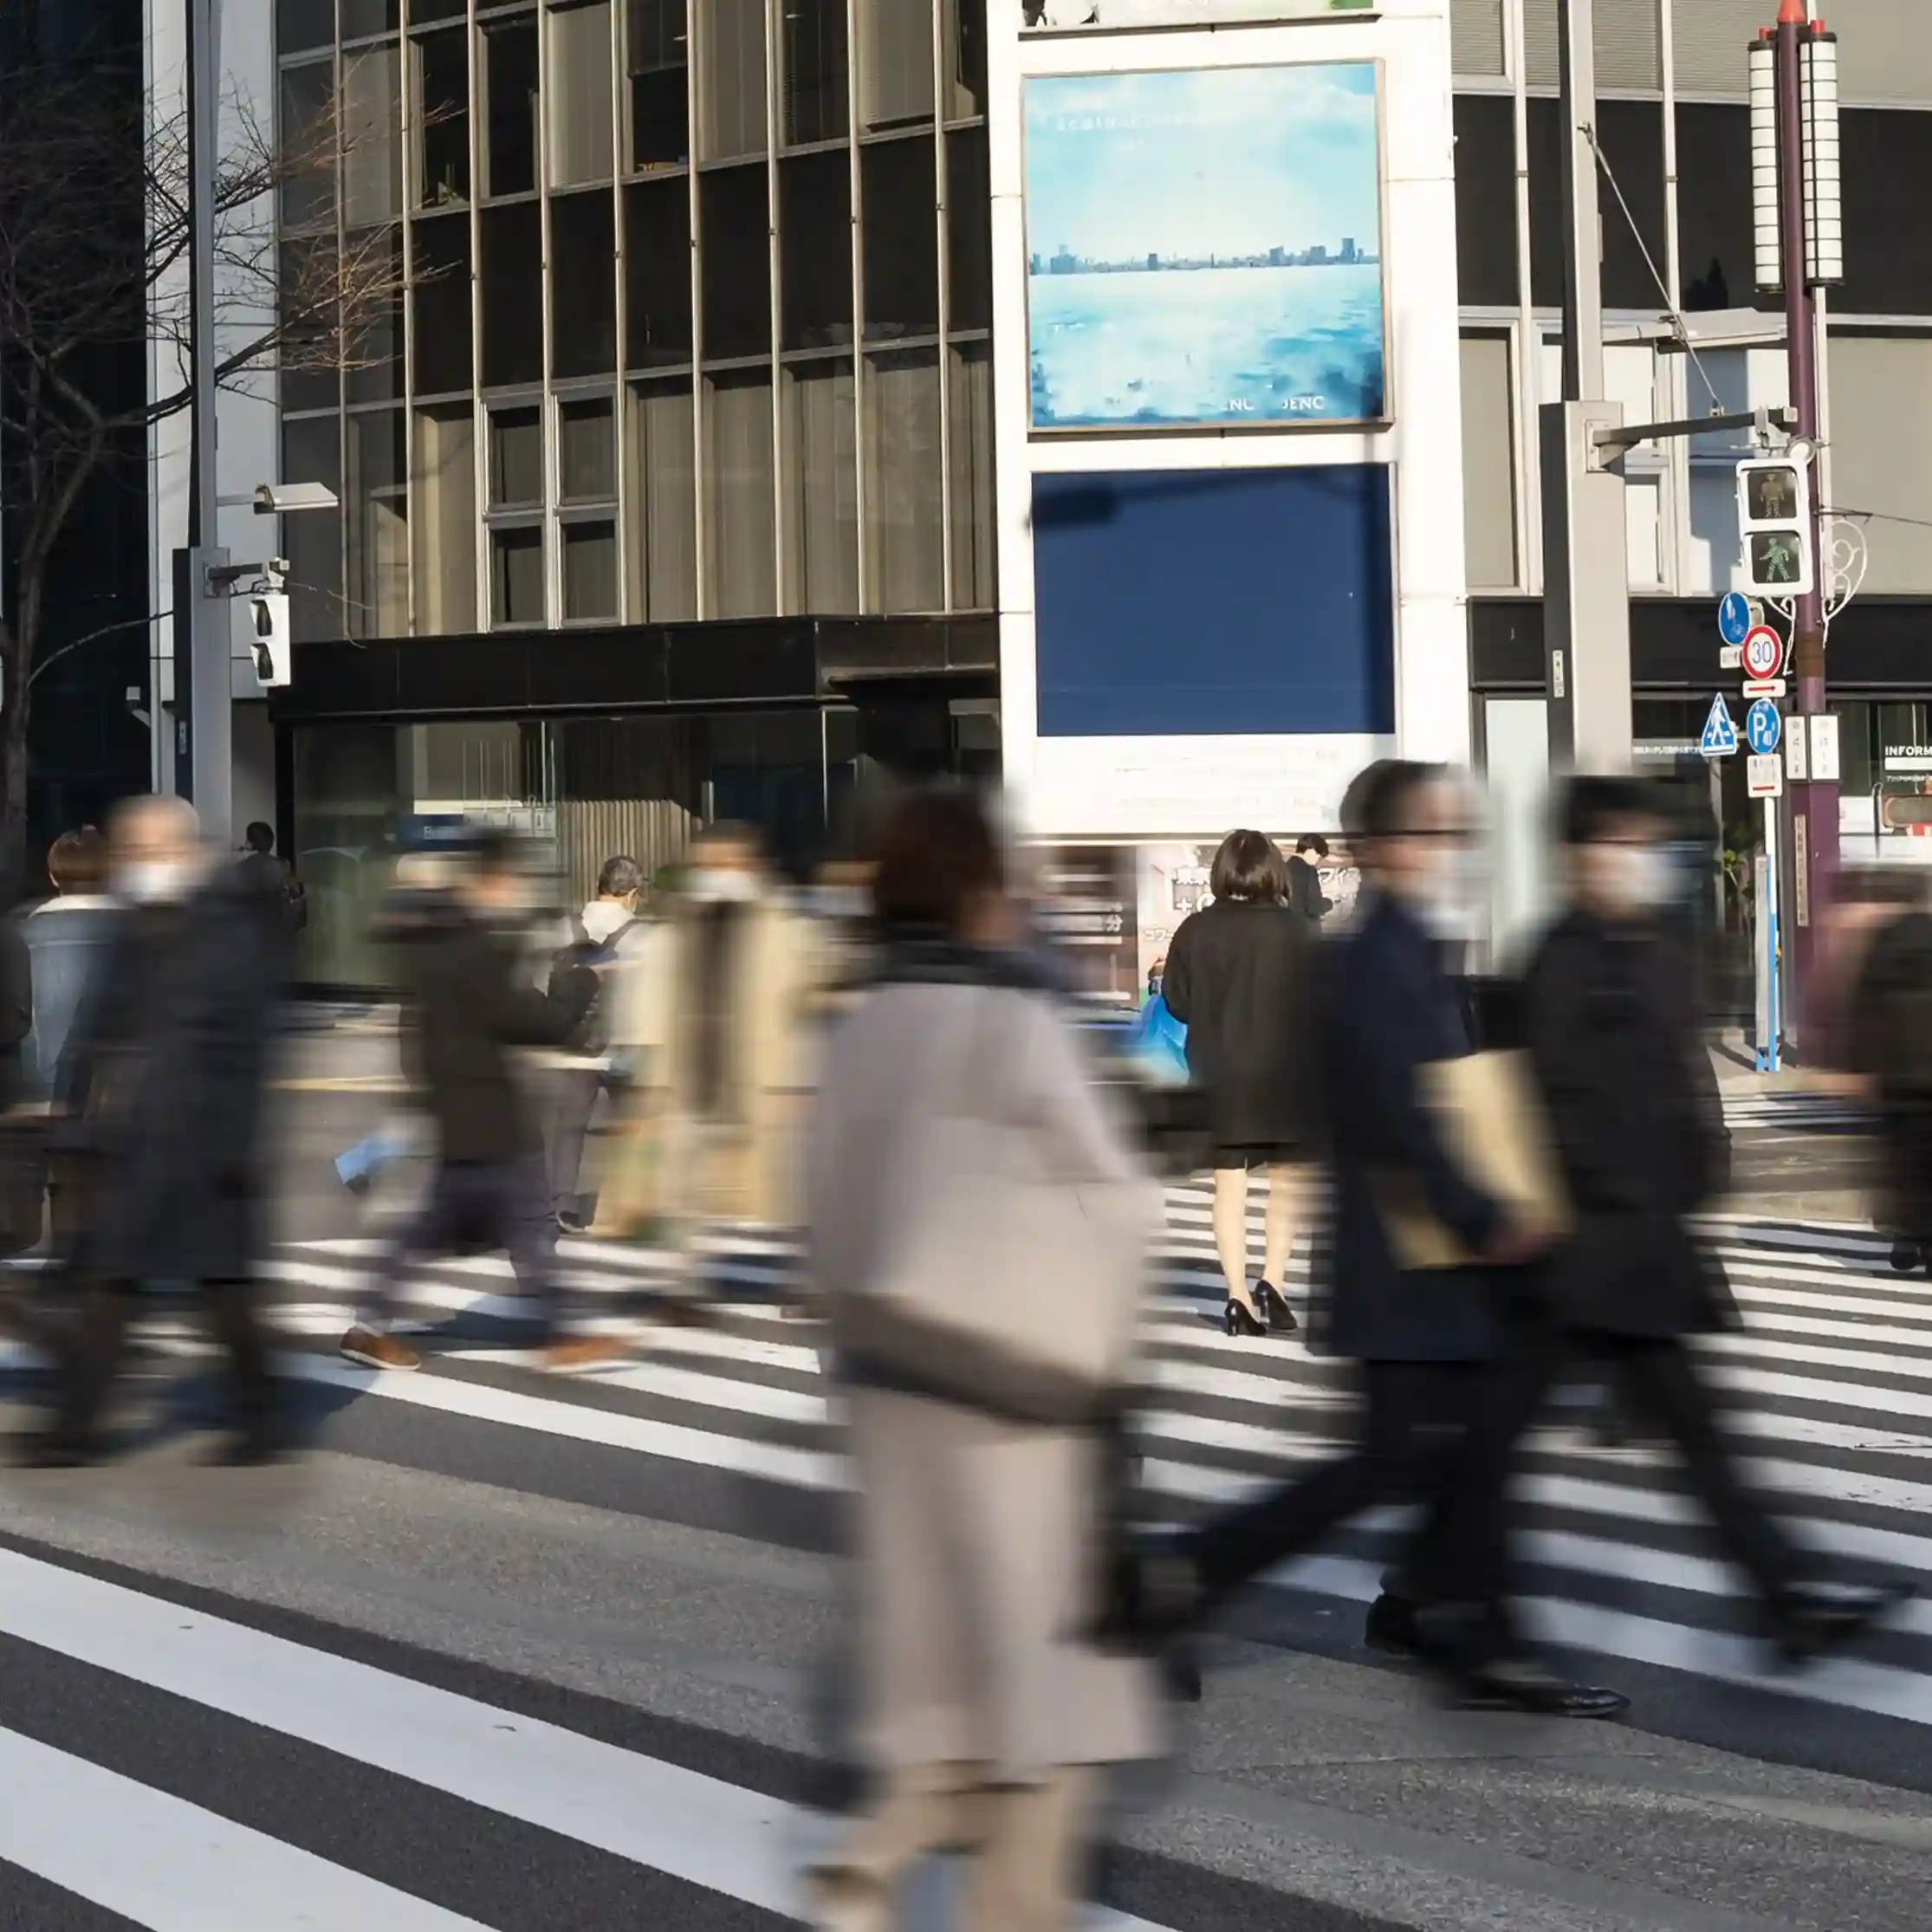
Pedestrian Volume
In urban areas like Makati, BGC, Ortigas, and those close to MRT and LRT stations, where people frequently walk, wait, or cross streets, pedestrian volume is particularly crucial. Stronger involvement chances are frequently produced by these settings.
Dwell Time
Dwell time measures how long people remain within sight of a billboard. In traffic-heavy areas like EDSA, C5, or major intersections, longer dwell time increases recall and strengthens message retention.
Data to Design: How Foot Traffic Analysis Impacts Billboard Ad Customization
Billboard advertising also becomes more purposeful and effective once the marketer knows whom to target.
Messages can be tailored to highlight family-friendly products, price, or convenience if data shows a large number of young families in the population. Messages may focus on quality, reliability, or high-quality services in communities that are home to older, wealthier professionals.
These learnings also affect design decisions. The use of words, contrast colors, and picture selection occurs in relation to the speed at which individuals travel and their likely duration of dwell time. Although areas of high dwell time support simpler messages, short and bold fonts correlate best to fast traffic flow. All these design elements receive justification related to visibility and impact.
Harness Foot Traffic Data With Calton Datx’s Advanced Demographic Analytics Tool
The effectiveness of billboards in a market as dynamic as Metro Manila depends on converting exposure into quantifiable outcomes. Understanding how many people really see a billboard, who they are, and how that visibility converts into ROI is made possible by modern analytics.
Advertisers may use these services to better understand foot traffic patterns, behavior, or movement trends within Metro Manila through the use of audience analytics solutions offered by Calton Datx. Brands are able to place their advertisements in intelligent locations, maximize their concepts, or even closely monitor their campaign performance through complex digital out-of-home analytics.
Calton Datx is a top supplier of foot traffic data for out-of-home advertising in the Philippines, assisting companies in converting Metro Manila’s movement into significant marketing outcomes.
Pingback: Would Skeleton Crew Staffing Work For Your Business?